Racial Demographics & Poverty Rates Across Five Types of Public Schools in St. Louis City
By : Amy Shelton, Ph.D.
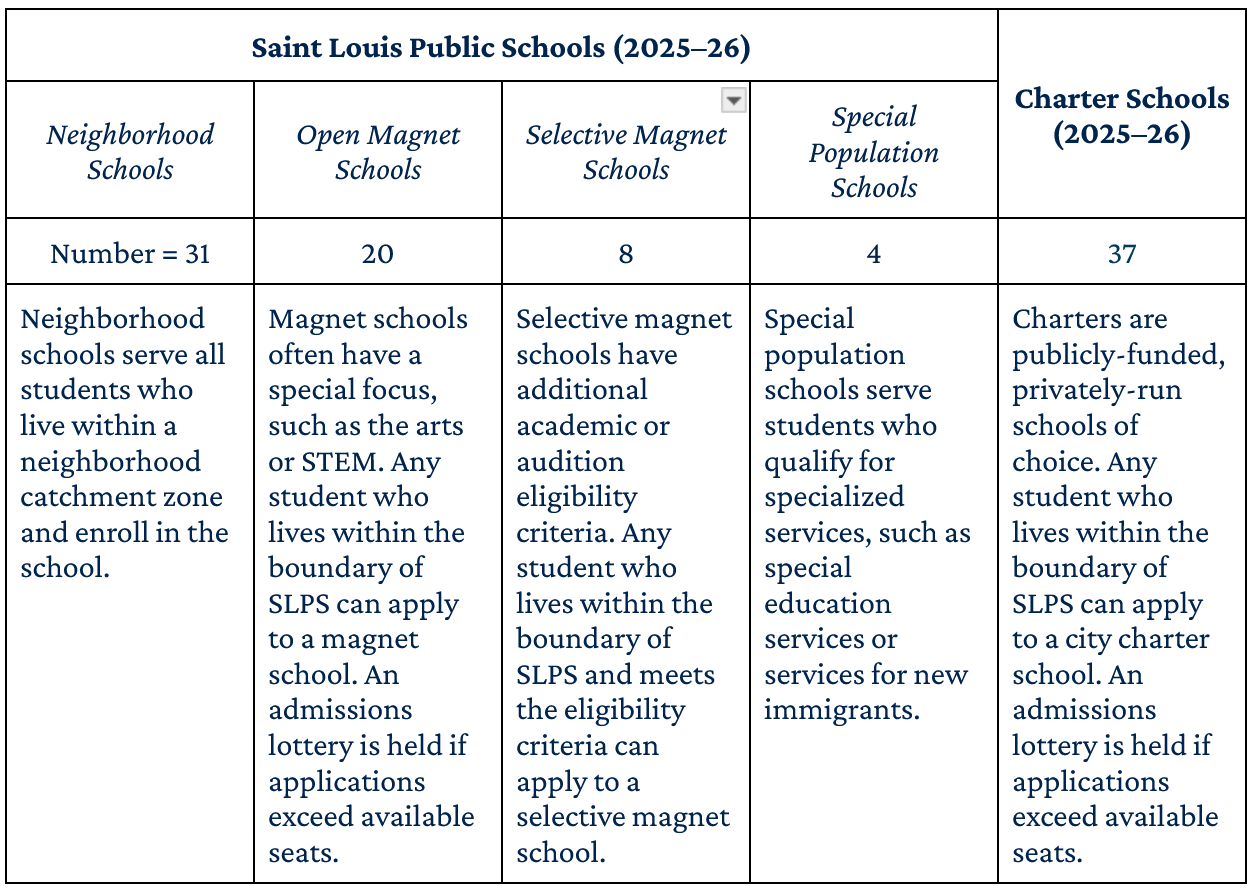
In this third blog in a four-part series, we examine demographic trends from fall 2019 through fall 2024 across five types of public schools in St. Louis City: Saint Louis Public Schools (SLPS) neighborhood schools (31 schools in 2025–26), SLPS open magnet schools (20), SLPS selective magnet schools (8), SLPS special population schools (4), and 37 public charter schools operated by 17 charter local education agencies (see definitions in Table 1).
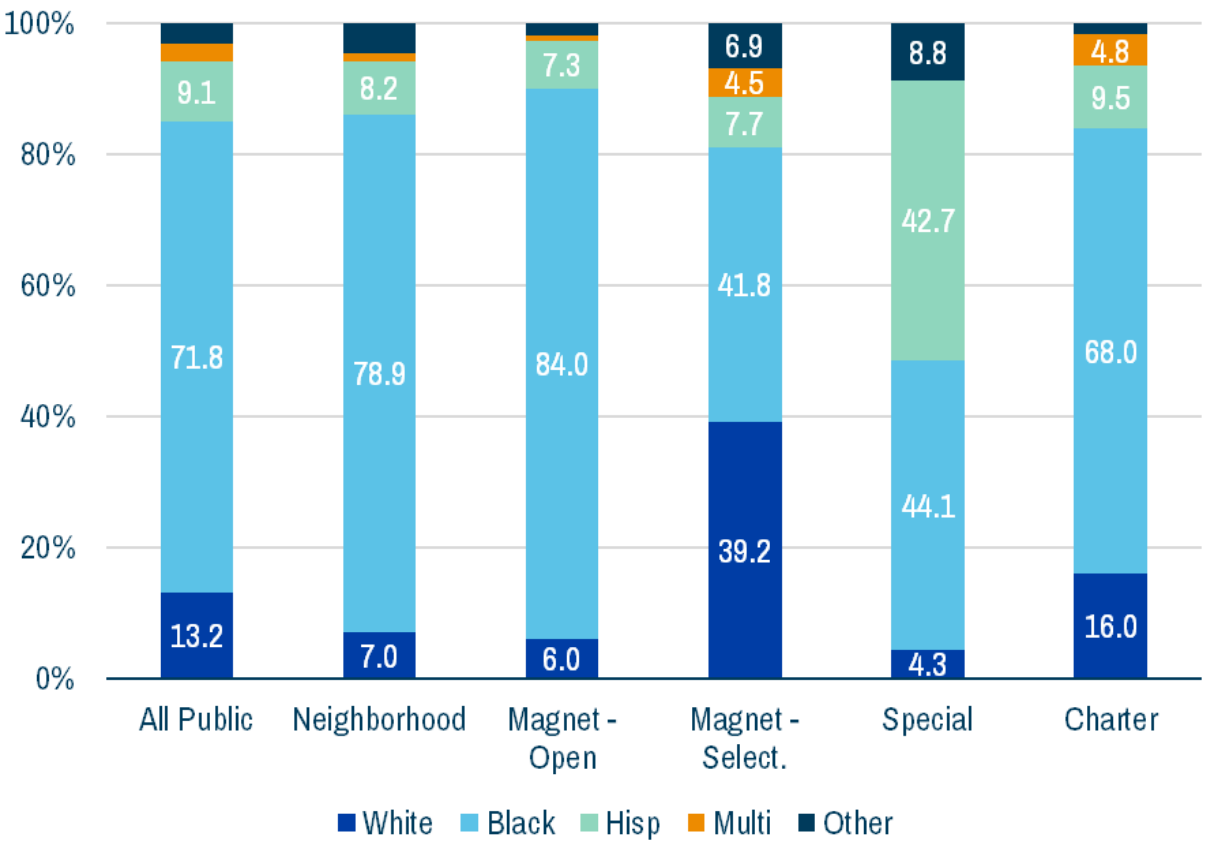
Racial disproportionalities abound across public school types in St. Louis City. In fall 2024, the public school population was 71.8% Black, 13.2% White, 9.1% Hispanic, and 2.8% multiracial (Figure 1). The percentage of Black students is highest in open magnets and neighborhood schools, while the percentage of White students is highest in selective magnets (approximately 40% White).
FIGURE 1
Racial Disproportionalities Abound Across Public School Types in St. Louis City
Racial Demographic Percents by Five St. Louis City Public School Types (Fall 2024)
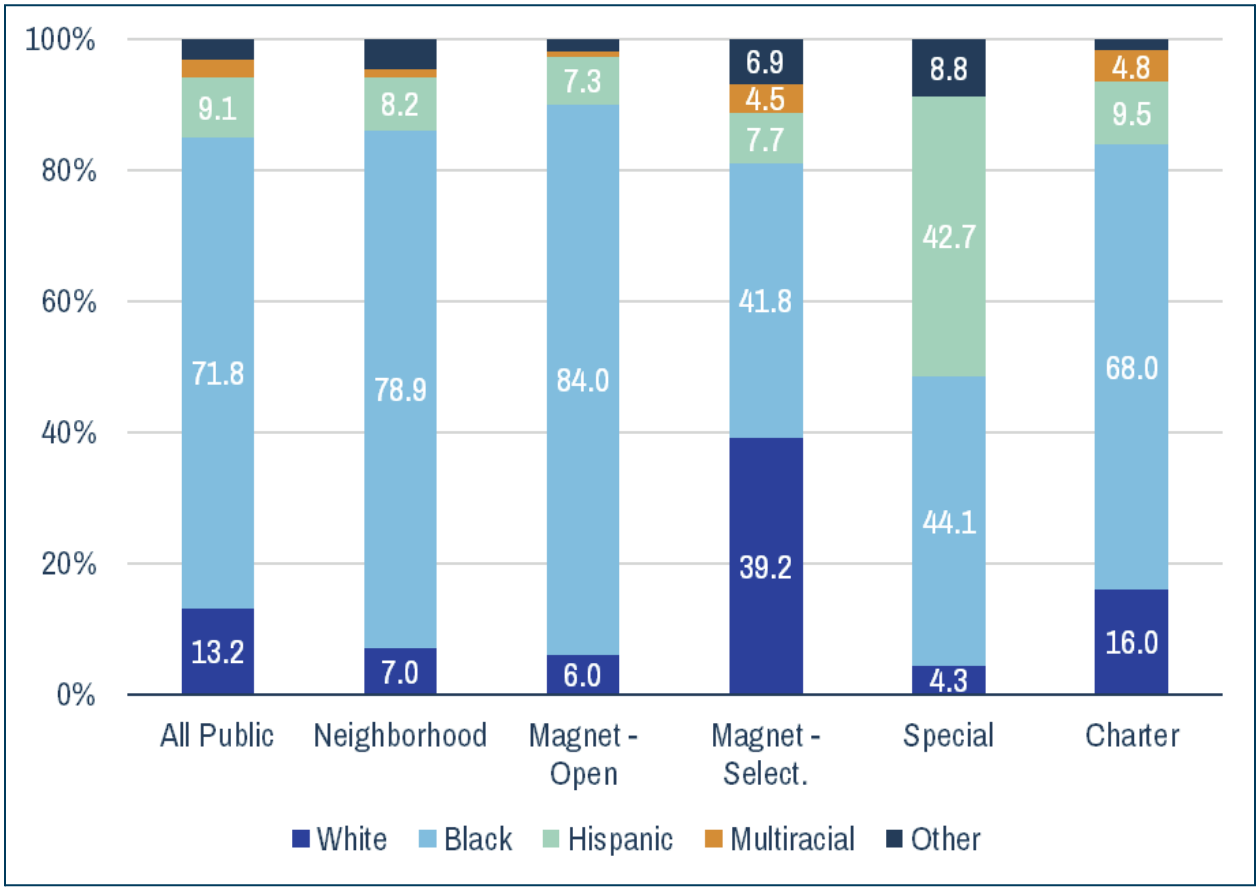
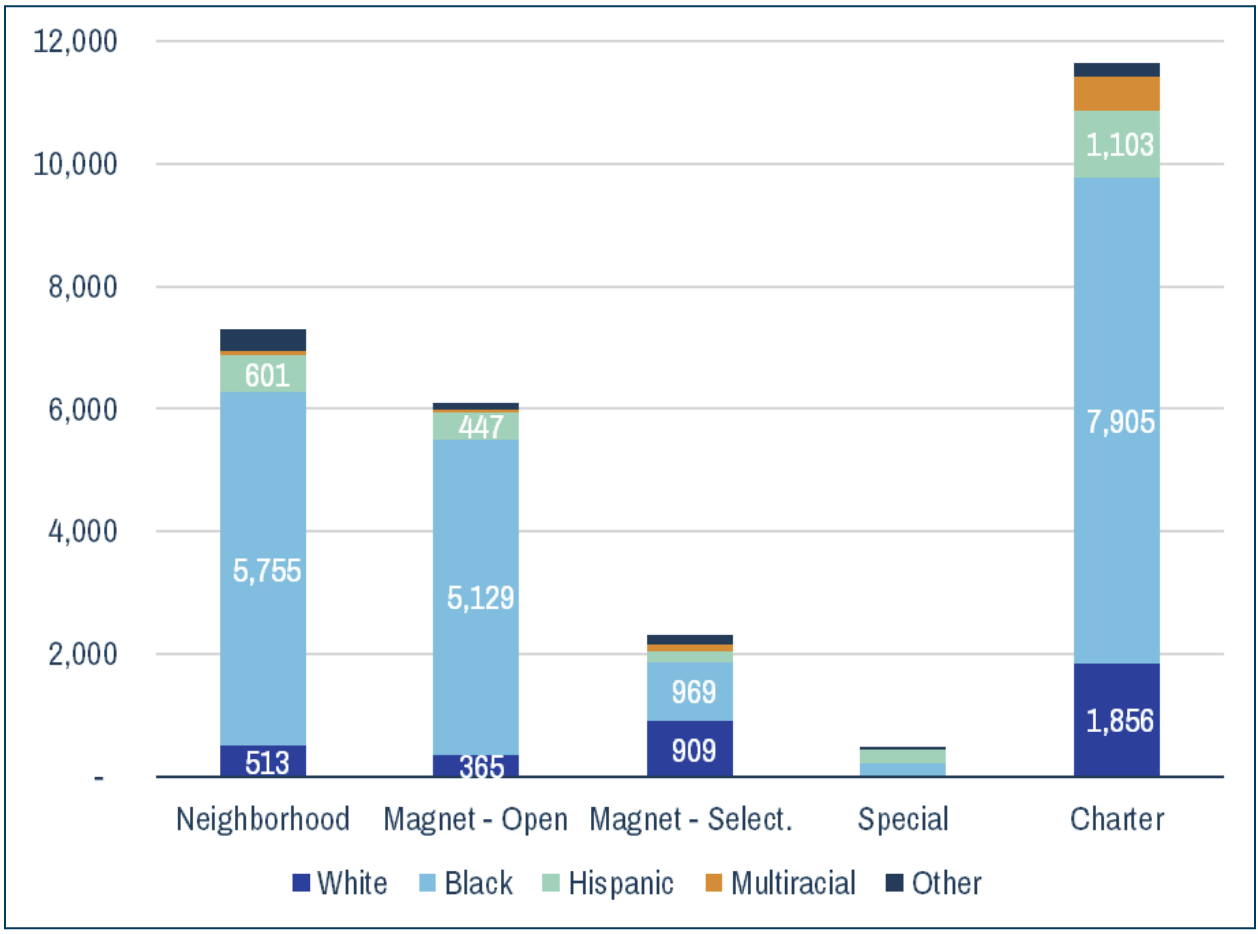
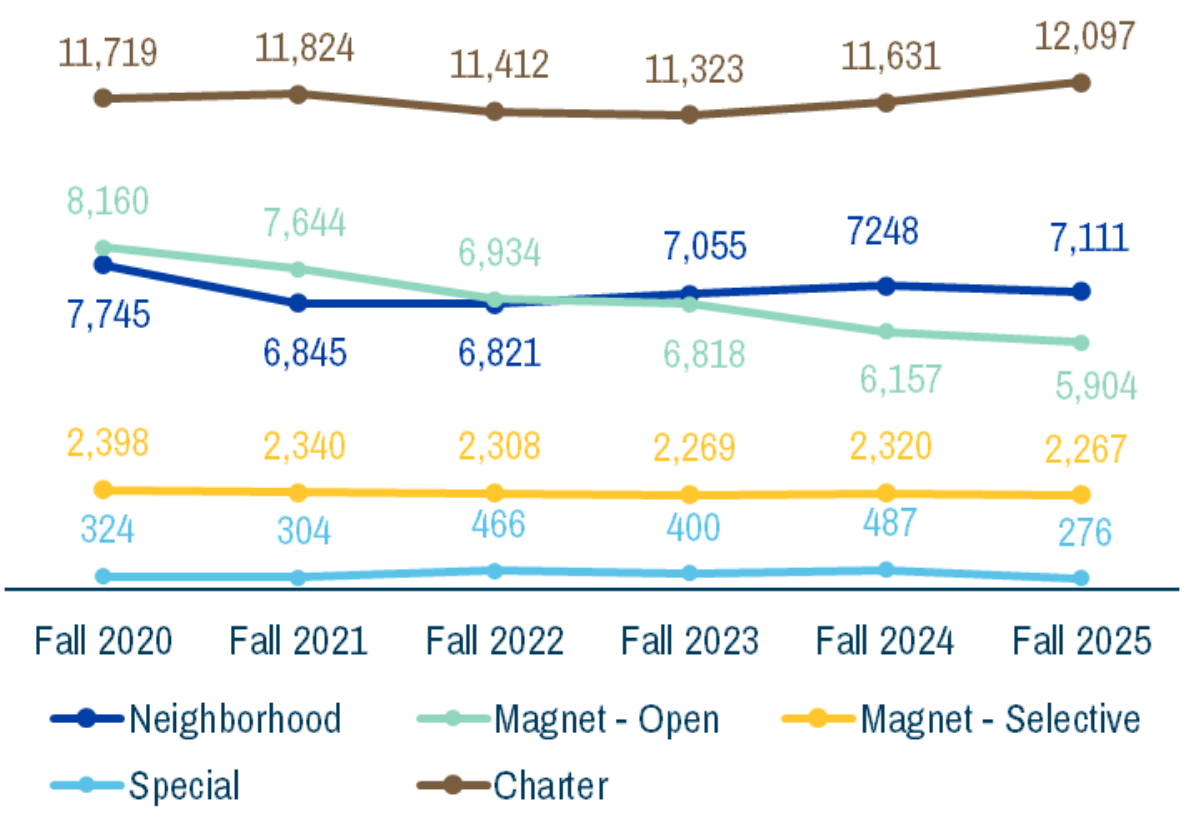
Figure 2 shows the number of students by racial group in each public school type. SLPS serves 56.3% of the city’s public school population but 60% of the city’s Black students, particularly in neighborhood schools and open magnets. The charter school sector is predominately-Black, but charters also serve half of the White and Hispanic public school students in the city.
FIGURE 2
Charter Sector Serves 40% of All Black Students, Half of White or Hispanic Students
Racial Demographic Numbers by Five St. Louis City Public School Types (Fall 2024)
The percentage of students coming from low-income families is highest in neighborhood schools and lowest in selective magnets. There is a known correlation between family income and student academic outcomes. We currently measure poverty at the school-level using “direct certification” rates, the percentage of students in a school who are automatically eligible for free or reduced price lunch because of enrollment in other means-tested programs, such as the Supplemental Nutrition Assistance Program (SNAP). Schools with direction certification rates at or above 40% are generally considered high-poverty schools. Selective magnet schools consistently serve a far lower percentage of students coming from low-income families than do other public school types (Figure 3).
FIGURE 3
Selective Magnet Schools Serve Lowest Percentage of Students from Low-Income Families
Percent of Students Directly Certified by Five St. Louis City Public School Types (Fall 2019–Fall 2024)
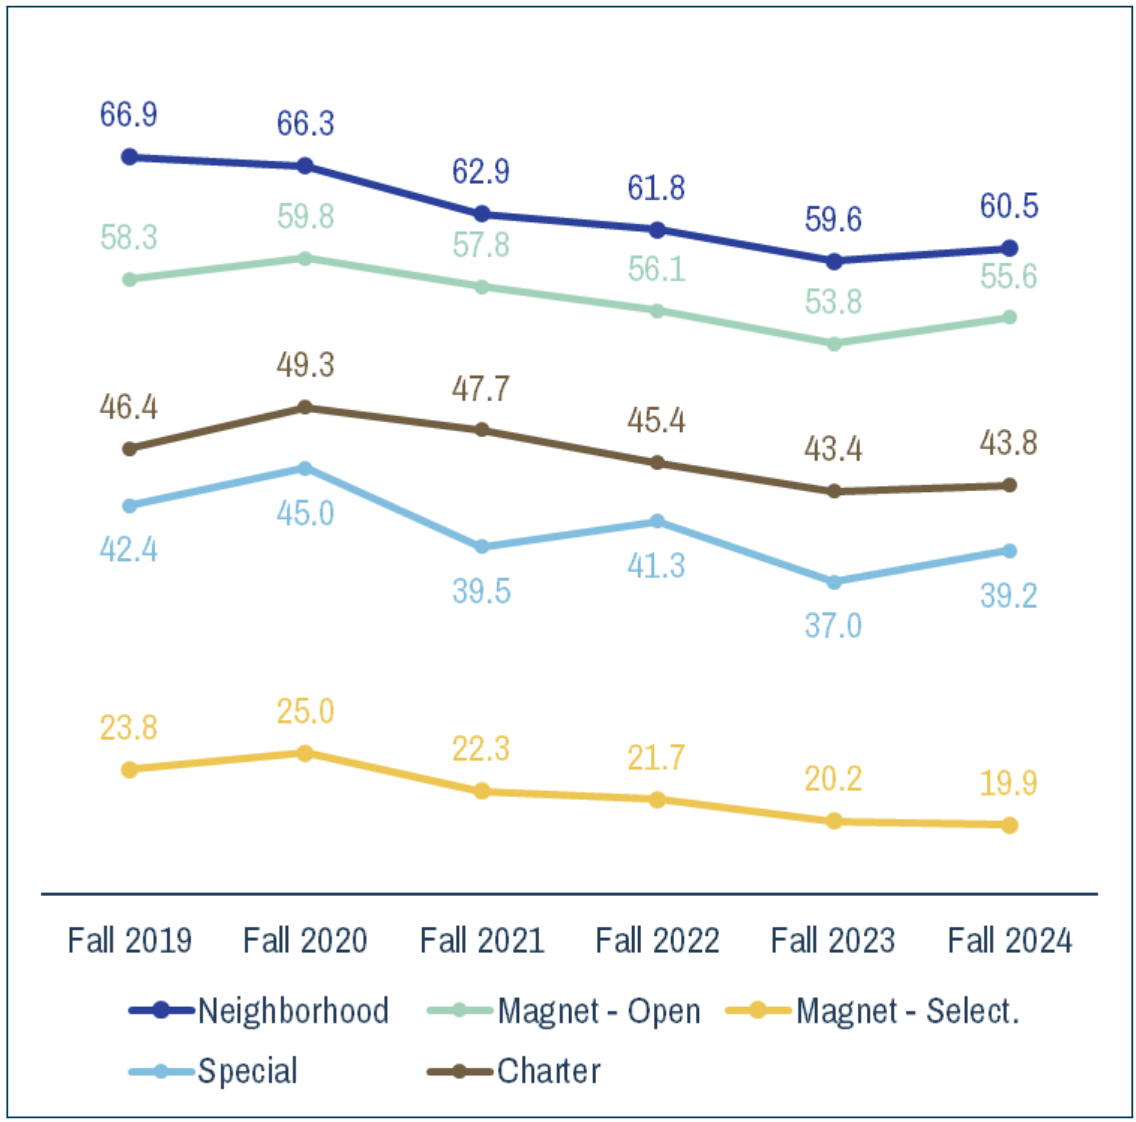
In four of five public school types, the percentage of students enrolled in programs such as SNAP peaked in the fall of 2020 during the COVID-19 pandemic. Direct certification rates declined after fall 2020 across all types, suggesting either an improvement in economic conditions or greater restrictions on enrollment in means-tested programs. We observe another increase in enrollment in programs such as SNAP in fall 2024.
Regardless of the broader context that explains these trends, students from low-income families have historically been concentrated in SLPS neighborhood and open magnet schools, while selective magnets serve a more economically-advantaged population than do other public school types. The known correlation between family income and student academic outcomes should inform our assessment of the academic performance of different types of schools.
TABLE 1
St. Louis City Has Five Types of Public Schools
Definitions of St. Louis City Public Schools Types
MORE FROM THE PRiME BLOGS

Here we report on the percent of students who are scoring at the proficient or advanced levels in ELA and math, for schools serving elementary and middle-grade students.