
Five things to Know About MAP Testing
By : Natalie Lo
Published On: February 16, 2026
What is MAP testing?
MAP, which stands for Missouri Assessment Program, is a set of standards based assessments that are administered online across the state of Missouri.
Who takes the MAP test?
All Missouri students in grades 3–8 take the MAP test, which consists of two assessments for all students—one in Mathematics and one in English Language Arts (ELA)—with students in grades 5 and 8 completing an additional Science assessment. Moreover, there are alternative MAP tests for students with cognitive disabilities and English Language Learners.
When is the MAP test administered?
The MAP test is administered in April-May of every year during school hours.
What does the MAP test measure?
The MAP test measures students’ skills in math, ELA, and science. These skills are designed to show progress and mastery of the Missouri Learning Standards, which the state of Missouri defines as expectations (standards) of knowledge and skills that students need to learn in each grade level to prepare for success in postsecondary life.
Why does the MAP test matter?
The Missouri State Board of Education states the purpose of MAP testing as identifying students’ strengths and weaknesses, serving as a basis for accountability plans, evaluating programs, and measuring student mastery towards post-secondary readiness. Data gathered from the MAP tests are used to evaluate student achievement according to the Missouri Learning Standards at the student, class, school, district, and state levels. By consistently testing all students every year, the MAP test serves as a consistent indicator of student progress over time.
MORE FROM THE PRiME BLOGS


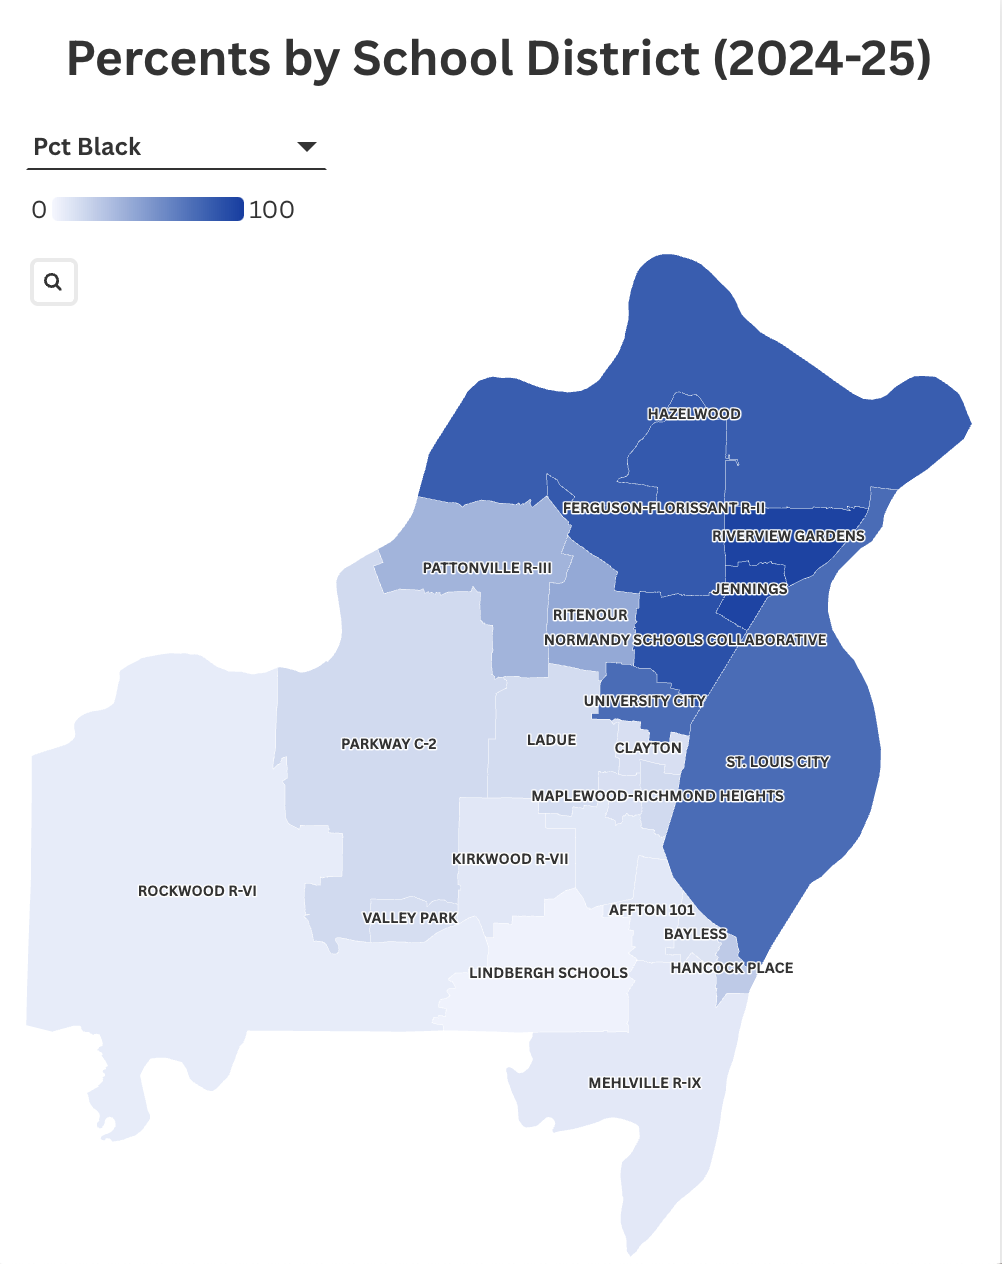
St. Louis County, Missouri is divided into 22 regular school districts that vary widely in geographic size and student enrollment, from 668 students in Valley Park to 18,595 students in Rockwood R-6 (2025–26). Student demographics and funding also differ starkly across districts. Lindbergh serves a population that is 2.7% Black, while the student population in Riverview Gardens is 96.5% Black (2024–25). And while Jennings and Clayton both serve just over 2,000 students, Jennings had $8,731 to spend per student in 2024–25, while Clayton spent $24,862. What explains the number of districts and the disparities between them?