
Why is Educational Opportunity in St. Louis So Unequal? How Past Housing Discrimination Still Shapes Communities & Schools
By : Amy Shelton, Ph.D.
This research was presented on July 22, 2026 at the SLU School of Education Summer Learning Institute.
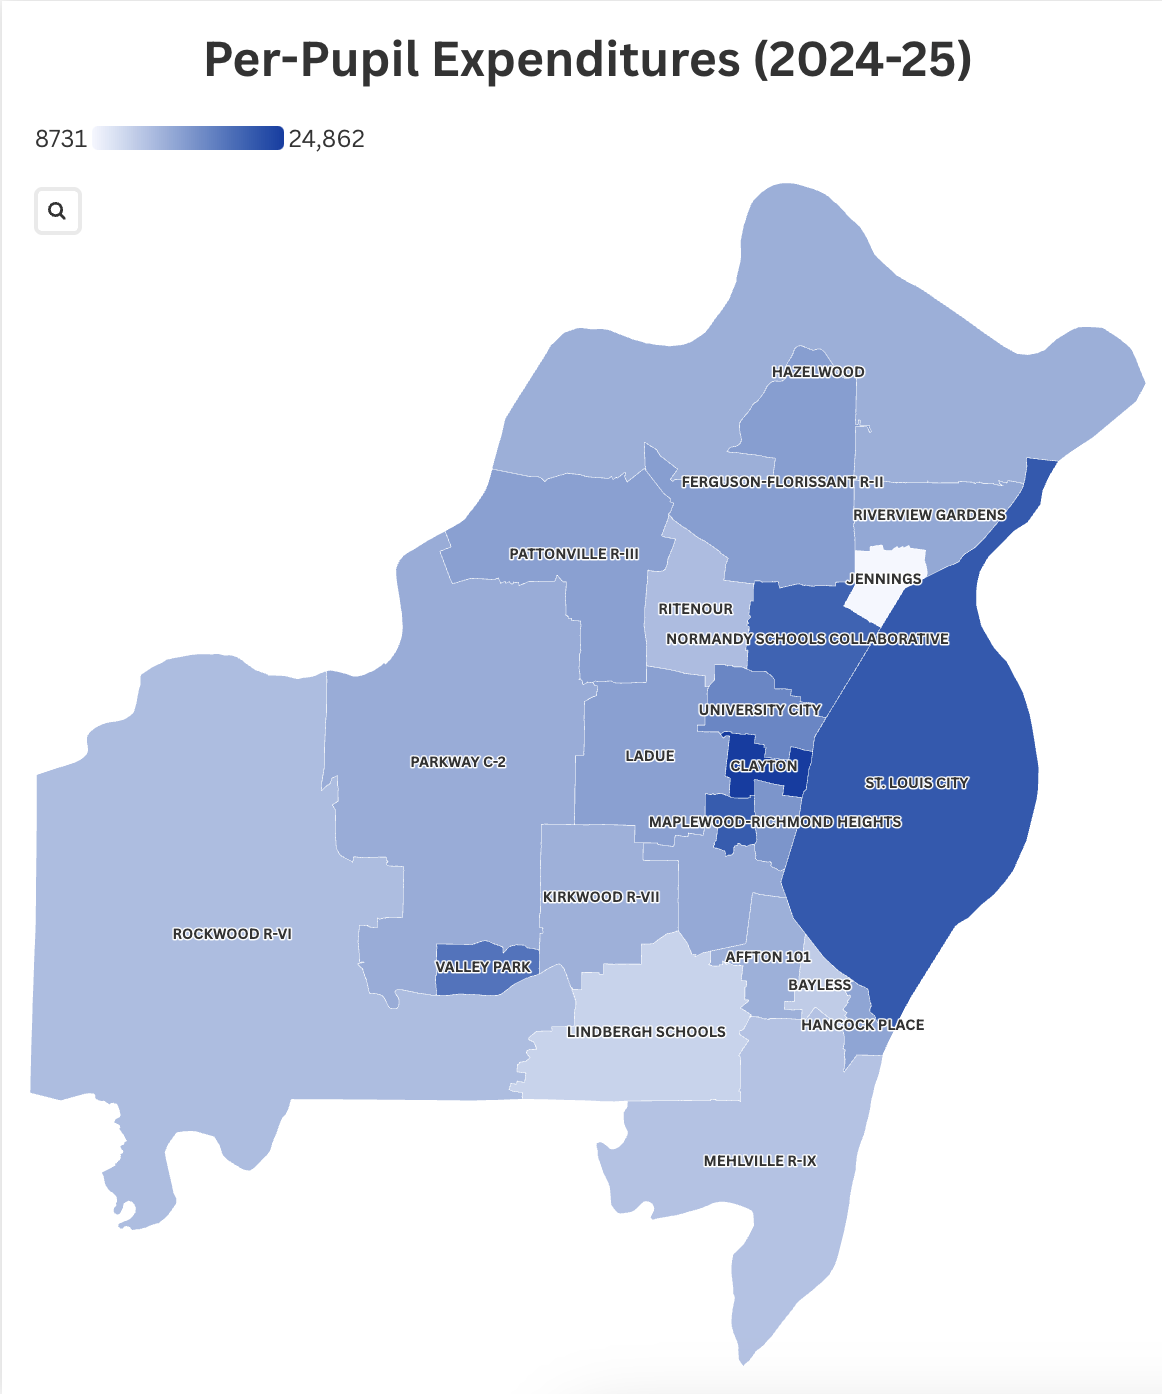
There are 23 geographic school districts across St. Louis City and County, and district boundary lines can determine which students have access to educational opportunity in our region. Per pupil spending in 2024–25 ranged from $8,731 per year in Jennings (0.4% White) to $24,862 per year in Clayton (61.2% White). Why this stunning disparity? Past local and federal policies prevented Black families in St. Louis from buying homes and building wealth, and our dependence on local property taxes to fund schools ensures past housing discrimination leaves a legacy today.
Educational Inequality: The Tip of the Iceberg
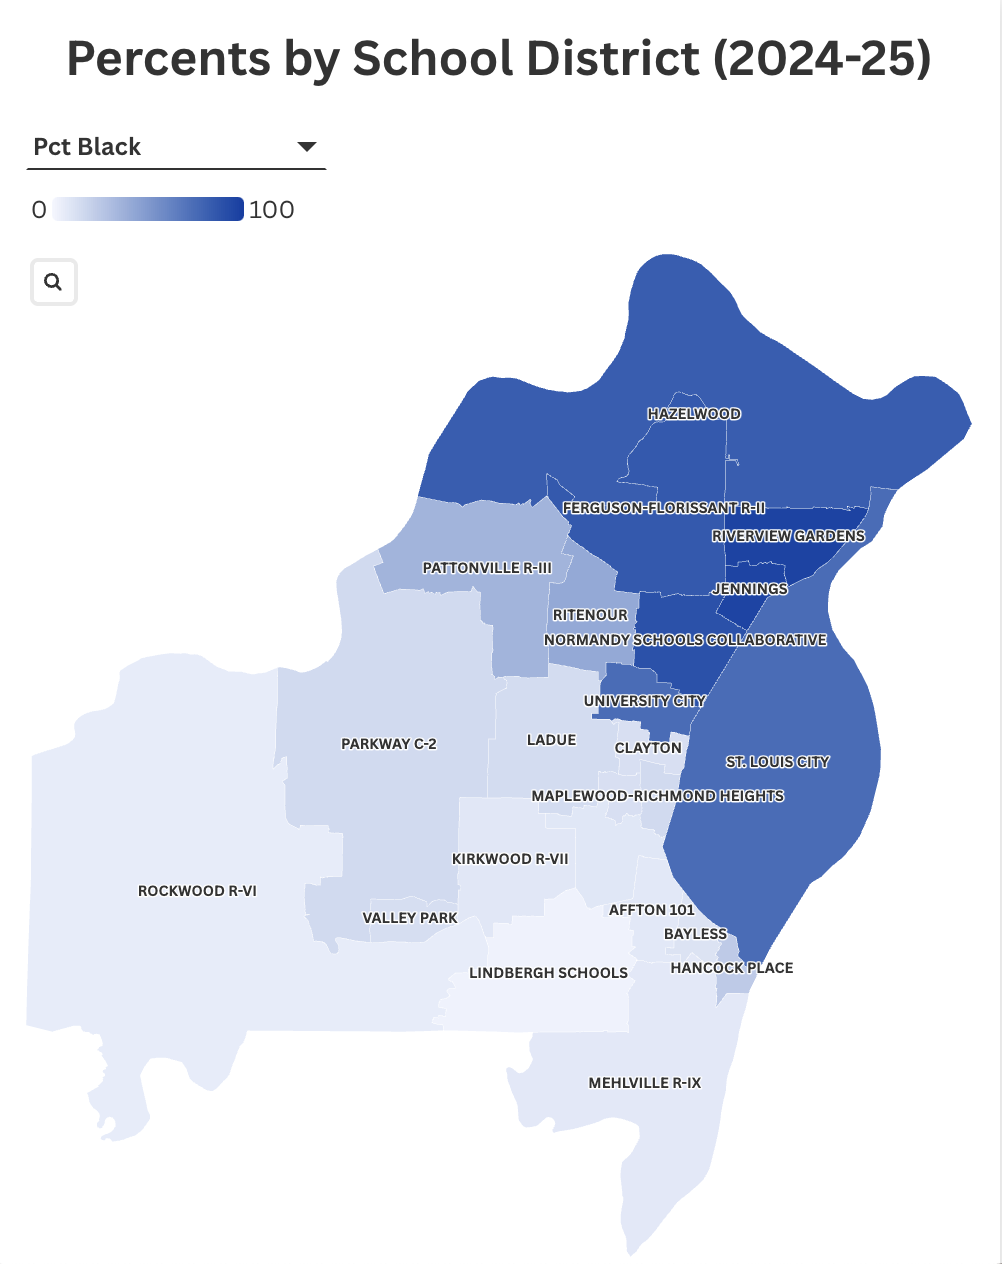
If Missouri’s school funding formula worked as intended, high values (darker shades) on a map of per-pupil expenditures (Map 1) should mirror high values on a map of the percent of students eligible for free or-reduced price school lunch (Map 2). Instead, we observe no apparent relationship between funding levels and the relative need of students. Why is this?
MAP 1
Funding Disparities Abound Across St. Louis Area School Districts
Per-Pupil Expenditures by St. Louis School District (2024–25)
MAP 2
St. Louis City and North County Districts Serve High Percentages of Low-Income Students
Percent of Students Eligible for Free or Reduced-Price Lunch by St. Louis School District (2024–25)
Missouri’s school funding formula is used to calculate the “Revenue Entitlement” each district needs to provide an adequate education for its particular student population. The formula designates additional funding for districts serving above-average numbers of low-income students, students with disabilities, and/or English Language Learners. The state then calculates how much of the total “Revenue Entitlement” the district should be able to raise through local property taxes and promises to pay the remainder. However, two key factors drive the disparities we see across districts.
First, the state uses out-of-date property values from 2004 to calculate the amount a district can raise locally. Many districts raise much more than this, which leads to a surplus for these districts (the state is still paying out what it would have paid if property values really were at 2004 levels). The Missouri School Funding Modernization Task Force recognizes this problem and is hard at work to revise the formula.
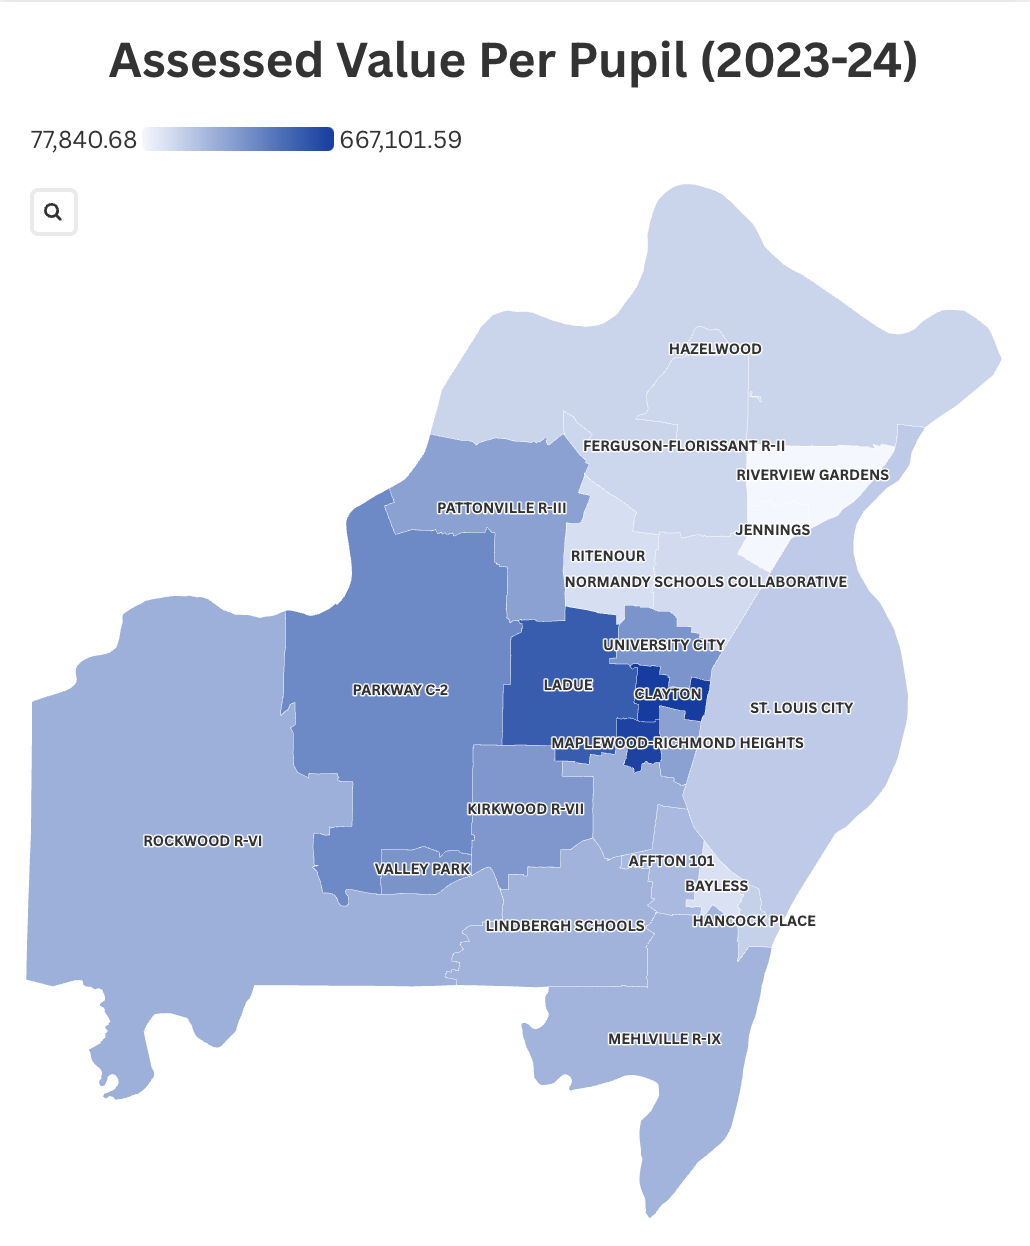
However, in addition to this, the state legislature has not always fully funded the education budget and did not fully fund the education budget for 2026–27. Districts highly dependent on state aid (property-poor districts) will have to operate with less than the bare minimum of what the state says they need to provide an adequate education.
MAP 3
West County Districts Have the Highest Property Wealth
Assessed Property Value per Student by St. Louis School District (2024–25)
But why is property wealth so unevenly distributed in the first place?
How Public Policy Segregated St. Louis
Have you heard? “The south was segregated by law, but segregation in the north just happened.” Not true, says researcher Richard Rothstein. “A more powerful cause of metropolitan segregation nationwide was the explicit intents of federal, state, and local governments to create racially segregated metropolises.” St. Louis provides a prime example of this.
The Great Migration and the East St. Louis Race Massacre (1917) brought thousands of Black newcomers to St. Louis. White St. Louisans responded by restricting where Black newcomers could live.
Segregating St. Louis City
Starting in 1910, at the encouragement of the St. Louis Real Estate Exchange, White homeowners in neighborhoods around the Ville began to add language to their housing deeds agreeing to never “sell, convey, lease or rent to a Negro or Negroes.” Sometimes White homeowners added racially restrictive covenants to existing deeds. More commonly, subdivisions were built with racial covenants already in place. The U.S. Supreme Court upheld the legality of racial covenants in 1926.
In 1916, St. Louis City voters, again at the encouragement of the St. Louis Real Estate Exchange, approved a racial zoning ordinance restricting Black residence to designated “Negro blocks.” One year later, the ordinance was ruled unconstitutional by the U.S. Supreme Court decision Buchanan v. Warley (1917). The St. Louis City Plan Commission then adopted a “race-neutral” city zoning ordinance in 1919, reinforcing segregation by designating White neighborhoods as “first residential” areas and hemming in Black neighborhoods with industrial zones.
In 1923, St. Louis realtors adopted a “code of ethics,” agreeing to only show homes to Black homebuyers in three “unrestricted” zones which closely mirrored the “Negro blocks” of the 1916 ordinance. Any realtor who broke this agreement could be considered guilty of professional misconduct and lose their realtors license.
The 1937 federal Homeowners Loan Corporation (HOLC) “redlining” maps mirrored the segregation that had been created through real estate practices. At the advice of local appraisers, HOLC “redlined” Black or racially-transitioning neighborhoods as “Definitely Declining” or “Hazardous” and too risky for mortgage lending. Black families living in these neighborhoods could thus not get a loan to buy a home.
The city also used the construction of public housing projects to further segregate the city. In 1942, the city cleared two racially integrated neighborhoods and opened two segregated housing projects, Carr Square Village on the north side for Black residents and Clinton-Peabody on the south side for White residents. The federal Housing Act of 1949 explicitly permitted local authorities to design separate public housing projects for Black and White residents or to segregate Black and White residents within projects, as was the intent when the Pruitt-Igoe towers opened in 1949.
Because of housing discrimination, Black newcomers to St. Louis were severely limited in where they could live. Housing units in the densely populated Mill Creek Valley were increasingly subdivided to accommodate more Black families moving to St. Louis from the Jim Crow south. This forced overcrowding and neglect by absentee landlords led to substandard housing conditions, and in 1959 the city demolished the neighborhood in the name of “urban renewal.” Many of the residents were relocated to Pruitt-Igoe and then evicted and relocated again when the federal government dynamited the 33 towers in 1972.
Segregating St. Louis County
In 1934, the federal government put a stamp of approval on racial covenants when the Federal Housing Administration (FHA) made the existence of these covenants a condition for mortgage insurance in new suburban developments. By 1950, 80% of homes in St. Louis County had racial covenants.
The U.S. Supreme Court ruled in Shelley v. Kraemer (1948) that racial covenants were permitted as a private agreement between citizens but were unenforceable in state courts. However, this was too little, too late. Restrictive covenants had already shaped the racial geography of St. Louis.
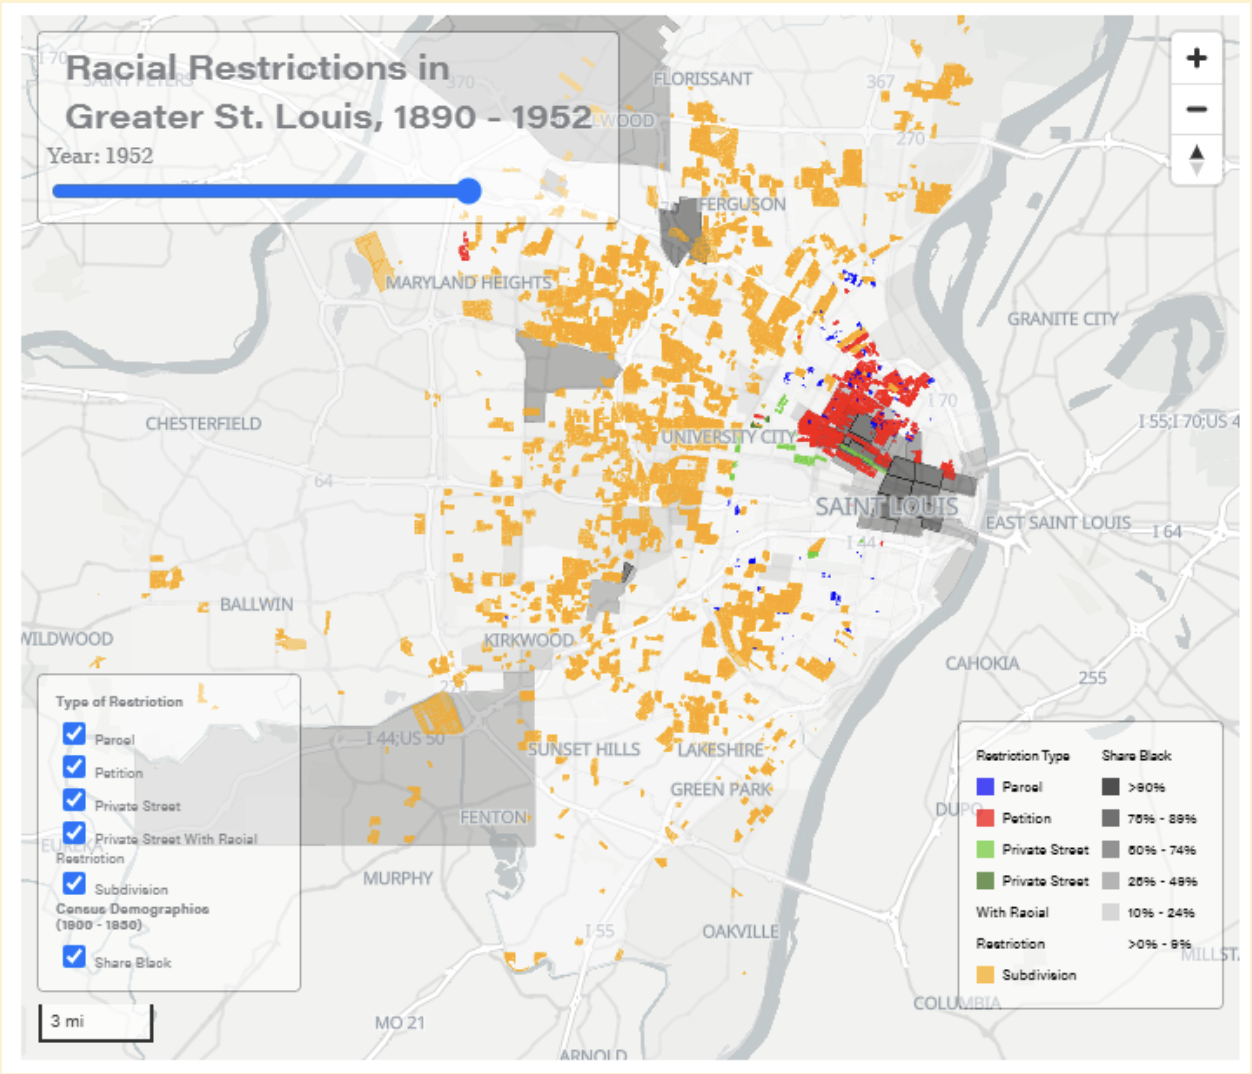
Credit: The interactive map linked here was designed by Jay Bowen of the University of Iowa Digital Scholarship and Publishing Studio and modified by St. Louis Public Radio.
St. Louis County municipalities also used “race-neutral” exclusionary zoning to segregate the region by income. Each County municipality had every incentive to zone for exclusivity, many prohibiting construction of multi-family housing and requiring large-lot, single-family homes. Generally speaking, the further out from the city you went, the more exclusive the zoning.
Conclusion
Throughout the early to mid 1900s, local and federal policies shaped St. Louis into the racially and economically segregated region we live in today. Black families were intentionally excluded from the opportunity to buy homes and start building wealth. Rothstein notes that only 35 of the 70,000 housing units built in St. Louis City and County between 1947 and 1952 were available to Black families because of FHA policy, racial covenants, or real estate practices. The Fair Housing Act of 1968 banned discriminatory practices in housing, but by this time many of the federally-subsidized starter homes available to White families a generation earlier were no longer affordable.
Past policies help explain why wealth is distributed so unevenly across our region, and our current school funding formula ensures property wealth disparities create educational opportunity gaps for St. Louis kids. We as Missourians have the opportunity to rethink how we fund schools so that all our kids have access to the high-quality education they deserve.
We must also remind ourselves and our neighbors that the segregation and inequality we observe in our region is not just “the way things are.” St. Louis was designed this way, and it will require our collective will to design our future for equity.
Recommended Sources
Forward Through Ferguson. (2020). Still separate, still unequal. https://stillunequal.org
Gordon, C. (2008). Mapping decline: St. Louis and the American city. Web project. http://mappingdecline.lib.uiowa.edu/
Gordon, C. (2019). Citizen Brown: Race, democracy, and inequality in the St. Louis suburbs. Web project. https://scalar.usc.edu/works/citizen-brown/index
Hannah-Jones, N. (2014). School segregation, the continuing tragedy of Ferguson. ProPublica. https://www.propublica.org/article/ferguson-school-segregation
Hanshaw, A. (2026, June 2). Missouri school funding overhaul runs into a property assessment problem. Missouri Independent. https://missouriindependent.com/2026/06/02/missouri-school-funding-overhaul-runs-into-a-property-assessment-problem/
Kellogg, S. (2026, May 7). Missouri’s budget doesn’t fully fund K-12, reverts to original higher education funding. St. Louis Public Radio. https://www.stlpr.org/government-politics-issues/2026-05-07/missouris-budget-doesnt-fully-fund-k-12-reverts-to-original-higher-education-funding-plan
Rothstein, R. (2014). The making of Ferguson: Public policies at the root of its troubles. Economic Policy Institute. https://www.epi.org/publication/making-ferguson/.
Rothstein, R. (2019). Segregated by design. https://www.segregatedbydesign.com/
Ruff, C. (2022). 80% of St. Louis County homes built by 1950 have racial covenants, researcher finds. St. Louis Public Radio. https://www.stlpr.org/culture-history/2022-01-26/80-of-st-louis-county-homes-built-by-1950-have-racial-covenants-researcher-finds
Shelton, A. & Rohde-Collins, D. (2025). Urban renewal’s educational legacy: Black displacement and school segregation from Mill Creek to Pruitt-Igoe. https://www.primecenter.org/prime-blog/urban-renewal-in-education
St. Louis Realtors. (2024). Reimagining St. Louis: Increasing Black homeownership. https://www.stlrealtors.com/clientuploads/New_Website_PDFs/DEI/Reimagining_STL/20250925_StLouisREALTORS_ReimaginingSTLReport.pdf
Published September 2026
MORE FROM THE PRiME BLOGS


There are 23 geographic school districts across St. Louis City and County, and district boundary lines can determine which students have access to educational opportunity in our region. Per pupil spending in 2024–25 ranged from $8,731 per year in Jennings (0.4% White) to $24,862 per year in Clayton (61.2% White). Why this stunning disparity? Past local and federal policies prevented Black families in St. Louis from buying homes and building wealth, and our dependence on local property taxes to fund schools ensures past housing discrimination leaves a legacy today.