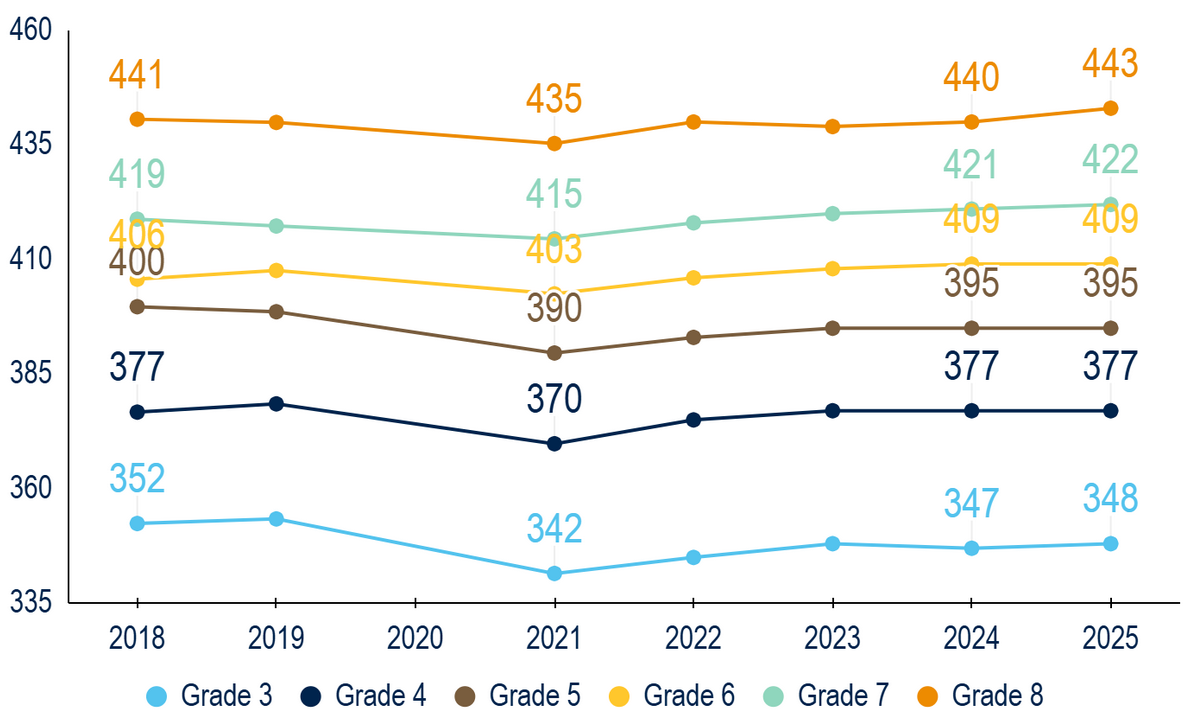
Positive Trends: For the second consecutive year, MAP Math test results exceed pre-pandemic levels. Reading results, following national trends, are more worrisome.
From 2021 to 2025, math test scores increased in every single grade that took the test (third through eighth), and all middle school grades (sixth, seventh, and eighth) saw an overall increase relative to pre-pandemic levels.

Student Growth Models: The 50-State Landscape
Every state tracks student growth, using statistical models that estimate annual student level growth in tested subjects. Different states use different models and methods. This policy brief examines the types of student growth models across U.S. states, focusing on their methodologies, transparency, and implications for educational equity. Growth models such as Student Growth Percentiles (SGP), Growth to Proficiency Models, and Value-Added Models (VAM) provide critical insights into student progress and inform accountability measures. This is the first, national, publicly-available data set of the student growth models used in each state. Analysis reveals a widespread reliance on SGPs and similar frameworks, with some states incorporating demographic controls to address equity concerns.

Missouri Growth 101: Why Missouri’s Growth Model is the Best in the Country
The PRiME Center’s Executive Director, Dr. Collin Hitt, breaks down the Missouri Growth Model and answers frequently asked questions about Growth Scores.